14.6 pprof
A great feature of Go's standard library is its code performance monitoring tools. These packages exist in two places:
net/http/pprof

runtime/pprof
In fact, net/http/pprof simply exposes runtime profiling data from the runtime/pprof package on an HTTP port.
pprof support in Beego
The Beego framework currently supports pprof, however it is not turned on by default. If you need to test the performance of your application, (for instance by viewing the execution goroutine) such information from Go's default package "net/http/pprof" already has this feature. Because beego has repackaged the ServHTTP function, you can not open the default feature included in pprof. This resulted in beego supporting pprof internally.
First in our
beego.Runfunction, we choose whether or not to automatically load the performance pack according to our configuration variable (in this case, PprofOn):if PprofOn { BeeApp.RegisterController(`/debug/pprof`, &ProfController{}) BeeApp.RegisterController(`/debug/pprof/:pp([\w]+)`, &ProfController{}) }Designing
ProfControllerpackage beego import ( "net/http/pprof" ) type ProfController struct { Controller } func (this *ProfController) Get() { switch this.Ctx.Params[":pp"] { default: pprof.Index(this.Ctx.ResponseWriter, this.Ctx.Request) case "": pprof.Index(this.Ctx.ResponseWriter, this.Ctx.Request) case "cmdline": pprof.Cmdline(this.Ctx.ResponseWriter, this.Ctx.Request) case "profile": pprof.Profile(this.Ctx.ResponseWriter, this.Ctx.Request) case "symbol": pprof.Symbol(this.Ctx.ResponseWriter, this.Ctx.Request) } this.Ctx.ResponseWriter.WriteHeader(200) }
Getting started
From the above, we can see that enabling pprof is as simple as setting the PprofOn configuration variable to true:
beego.PprofOn = true
You can then open the following URL in your browser to see the following interface:
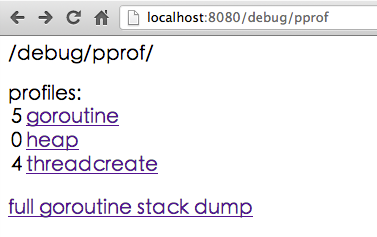
Figure 14.7 current system goroutine, heap, thread information
By clicking on a goroutine, we can see a lot of detailed information:
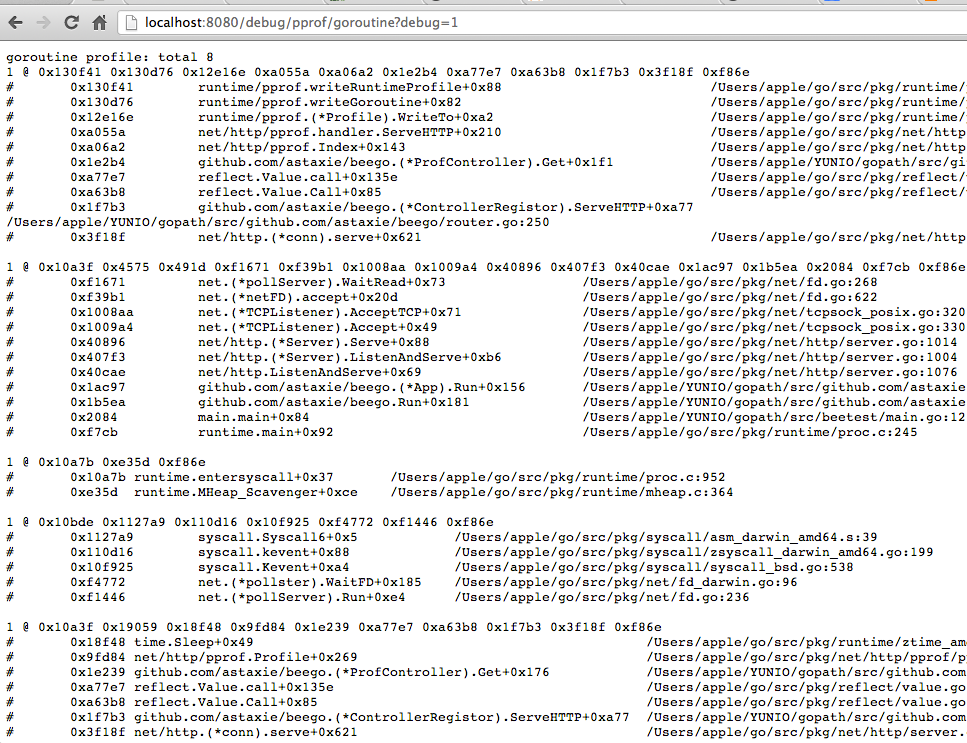
Figure 14.8 shows the current goroutine details
Of course, we can also get more details from the command line:
go tool pprof http://localhost:8080/debug/pprof/profile
This time, the program will begin profiling the application for a period of 30 seconds, during which time it will repeatedly refresh the page in the browser in an attempt to gather CPU usage and performance data.
(pprof) top10

Total: 3 samples

   1 33.3% 33.3% 1 33.3% MHeap_AllocLocked

   1 33.3% 66.7% 1 33.3% os/exec.(*Cmd).closeDescriptors

   1 33.3% 100.0% 1 33.3% runtime.sigprocmask

   0 0.0% 100.0% 1 33.3% MCentral_Grow

   0 0.0% 100.0% 2 66.7% main.Compile

   0 0.0% 100.0% 2 66.7% main.compile

   0 0.0% 100.0% 2 66.7% main.run

   0 0.0% 100.0% 1 33.3% makeslice1

   0 0.0% 100.0% 2 66.7% net/http.(*ServeMux).ServeHTTP

   0 0.0% 100.0% 2 66.7% net/http.(*conn).serve

(pprof)web
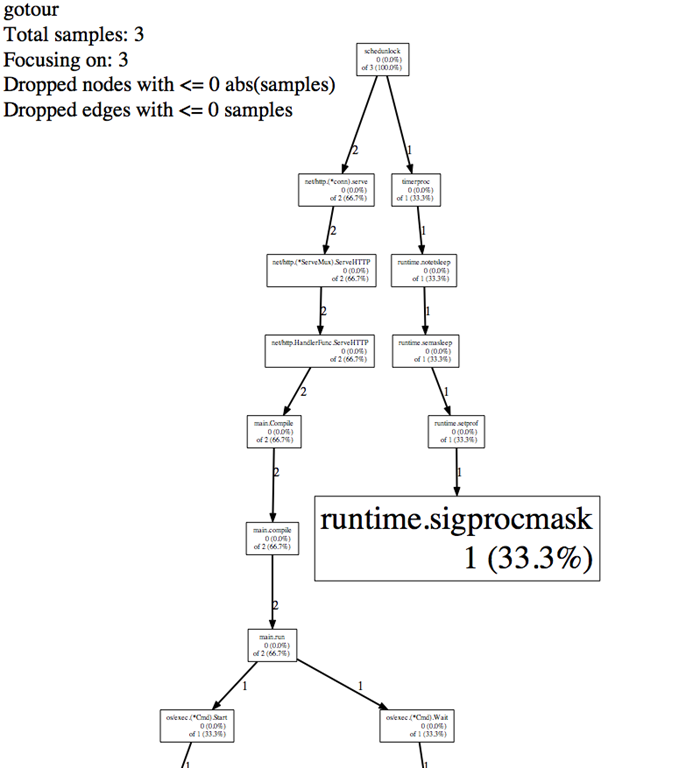
Figure 14.9 shows the execution flow of information
Links
- Directory
- Previous section: Multi-language support
- Next section: Summary